
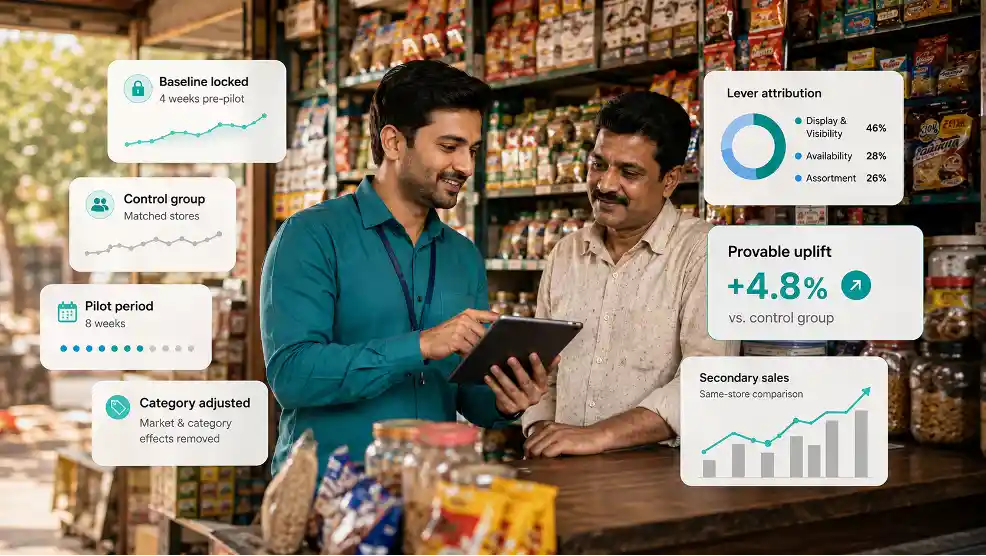
A DMS uplift percentage means nothing without a baseline and a period. Here is the measurement design that makes a secondary-sales number provable.
Every DMS vendor publishes an uplift number. Almost none publish how they measured it. That gap is the whole reason the numbers do not get believed. You prove a system raised secondary sales the way a trial proves a drug works: isolate the intervention against a baseline and a control, over a fixed period, and read the result lever by lever. A percentage on its own is a marketing asset, not a measurement. And in 2026 it matters more than ever, because the market moved in two directions inside one year. Per NielsenIQ's FMCG Quarterly Snapshot for Q4 2025 (OND 2025), released March 5, 2026:
India FMCG value growth reached 7.8%, rural recorded its 8th consecutive quarter of growth, and rural volume growth (2.9%) continued to outpace urban (2.3%).
When the tide rises here and falls there in the same quarter, a bare vendor percentage is unreadable. You cannot tell the tool from the tide. If you run a large distributor network and someone just claimed their DMS lifted your secondary sales, this is the measurement design to ask for before you believe it.
The short answer
An uplift claim is only provable when the vendor states four things: the baseline, the control, the fixed period, and the specific levers the gain is attributed to. Miss any one and the number could be the market, the season, or a lucky beat. Salescode AI Native DMS reports uplift this way on its Sales Impact Dashboard, lever by lever, so the figure is attributable rather than asserted.
Key takeaways
- • A percentage with no baseline, control, and period is a claim, not a result.
- • "Sales rose" tells you nothing without a same-store, category-adjusted comparison.
- • A pilot shorter than one full sales cycle plus a model retrain reports noise.
- • Five disclosures separate a real number from a guess. Ask for all five.
First, the term itself
Secondary sales is the distributor's onward sale to the retailer: what actually moved toward the shopper, not what the company billed the distributor.
Almost every commercial lever a brand pulls after manufacturing is a secondary-sales problem:
- • trade schemes
- • focus-product distribution
- • van load-out
- • credit exposure
That is why proving movement on secondary is worth the rigour, and why proving it is hard.
How do you prove a DMS raised secondary sales?
You isolate the system's effect: fix a pre-live baseline, hold back a comparable control, run for a set period, then attribute the difference to named mechanisms rather than to "AI."
Treat it like judging a new scheme. You do not credit a scheme just because sales rose during it. You judge it against the beats that did not get it, over the same weeks, adjusted for what the category did.
On Salescode AI Native DMS, that attribution is possible because prediction is a platform layer, not a report bolted on at the end. Every order, invoice, and stock movement feeds the models continuously, so the gain traces to the lever that produced it:
- • Fewer stock-outs, from SKU-level prediction.
- • Larger orders, from AI-recommended baskets.
- • Fewer returns, from optimised load-outs.
- • Recovered revenue, from outlets flagged by attrition prediction.
The Attribution Chain

The attribution chain. Remove any node and the number stops being defensible. Four named levers, each with its own before and after, beat one blended headline every time.
What is a fair baseline for a distribution pilot?
A fair baseline is the same outlets' own secondary-sales run rate just before go-live, compared like for like and adjusted for what the wider category did over the pilot.
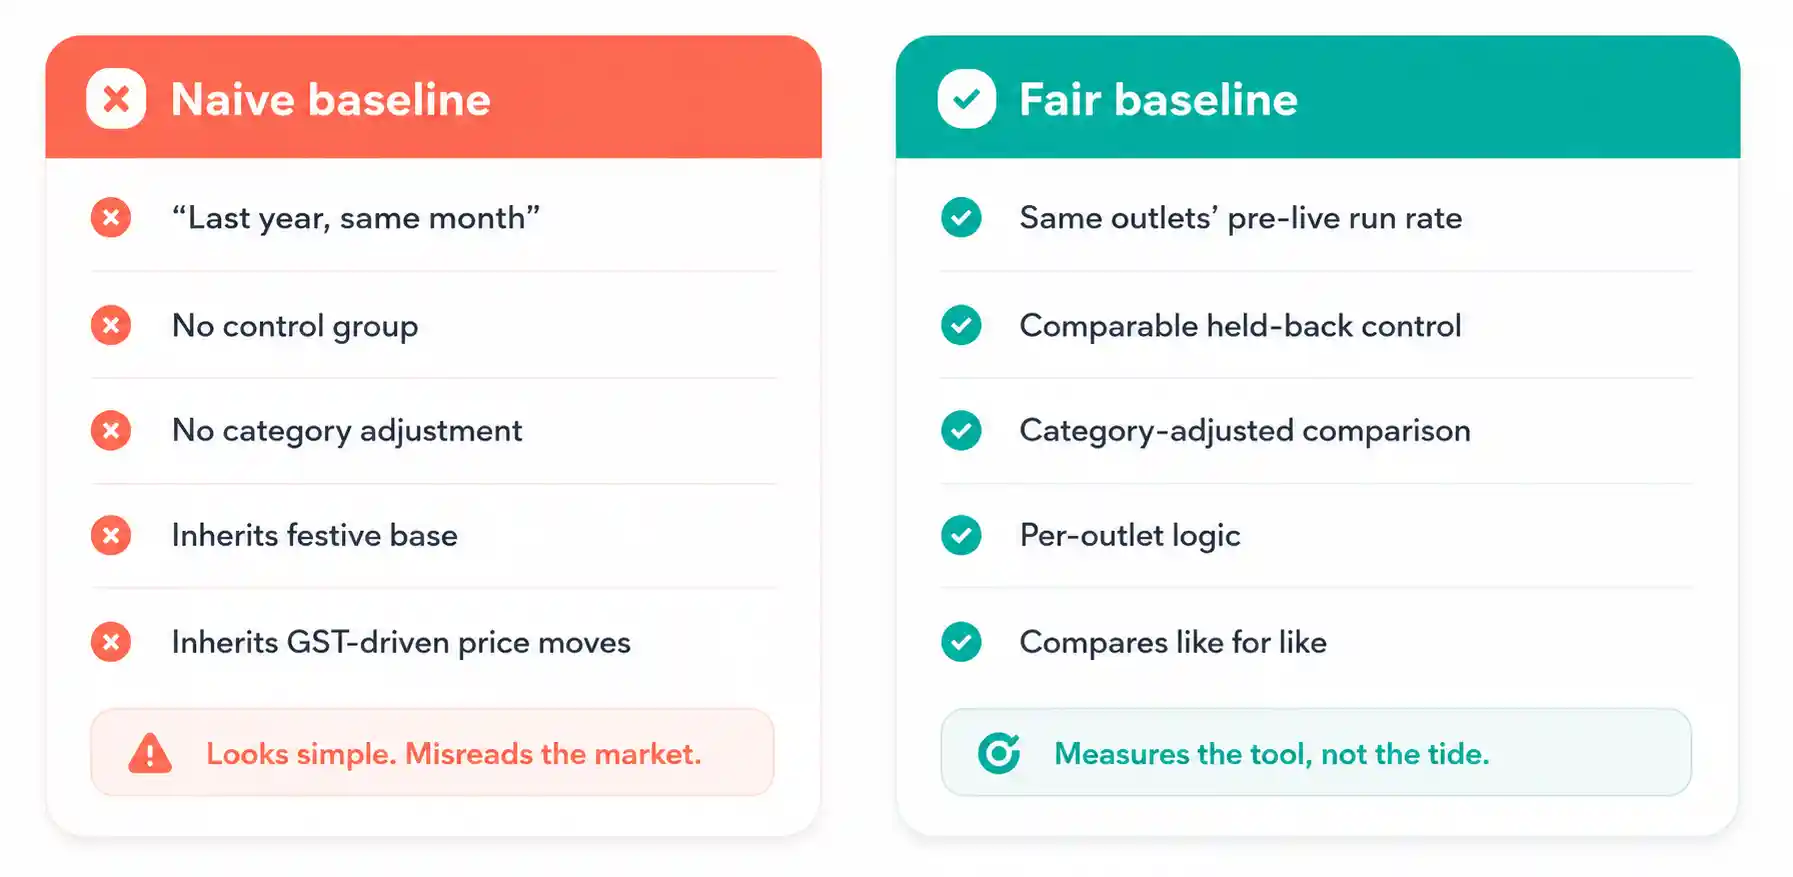
A loose baseline lets ordinary market movement pose as vendor impact. This is exactly where the 2026 numbers bite. A flat "last year, same month" comparison inherits:
- • last year's festive base
- • this year's GST-driven price corrections
- • a rural-versus-urban split that shifted again
NielsenIQ's own quarter showed value and volume softening sequentially during the GST transition, sharpest in Traditional Trade. A pilot that ignored that would over-credit or under-credit the tool by accident of timing.
The cleaner logic is per-outlet, not top-down. Set each outlet's next target as a small, achievable increase over its own recent baseline, not a flat number pushed down from head office. Measure the way you target. Judge each outlet against its own prior run rate, then check whether the lift survived once you subtracted the category.

Naive Baseline VS Fair Baseline
The baseline choice decides the answer before the pilot starts.
How long must a pilot run before the number means anything?
Long enough to cover one full sales cycle plus at least one model retrain. For most FMCG portfolios that means weeks, not days.
A four-week reading over a festive spike or a GST re-pricing window measures the weather, not the tool. Duration is a function of your seasonality, so the honest checks are:
- • Does the window cover a full order cycle, end to end?
- • Does it include at least one model retrain, so you are past the cold start?
- • Do the good weeks and the flat weeks both sit inside it?
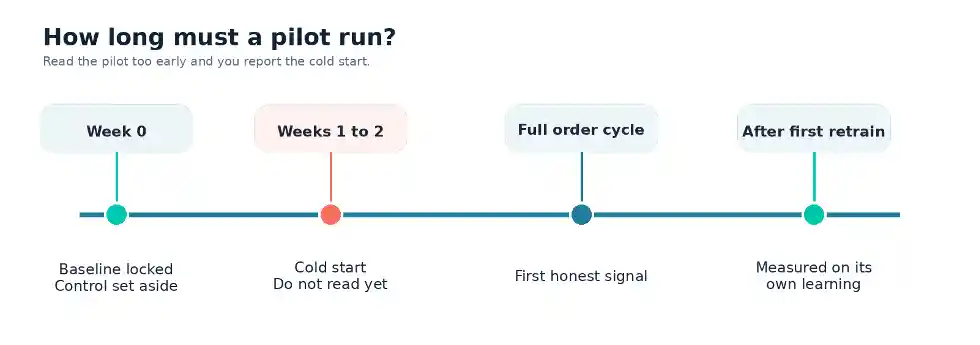
Read the pilot too early and you report the cold start.
There is a tell worth using. A vendor confident in its measurement names the minimum period and explains why. A vendor selling a number quotes the shortest, best-looking window it can find. Ask which weeks the figure covers before you ask how big it is.
What should a vendor be asked to disclose about its uplift figure?
Ask for five disclosures: the baseline, the control, the period, the attribution method, and the category adjustment. If a vendor cannot give all five in plain language, treat the number as decoration.
These are not gotcha questions. A real measurement produces all five as a by-product. Keep this table in your evaluation notes:
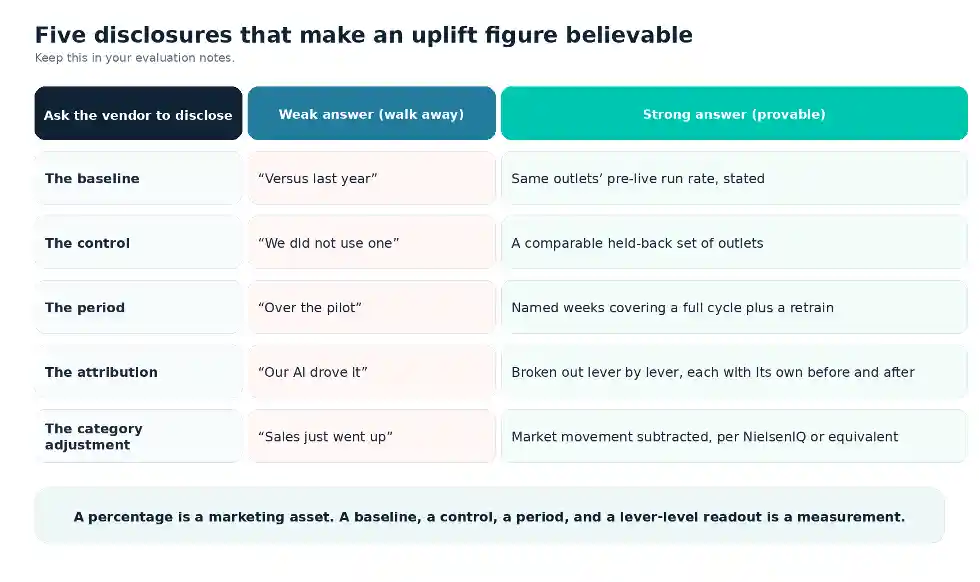
The five disclosures that separate a real measurement from a decorative number.
A percentage is a marketing asset. A baseline, a control, a period, and a lever-level readout is a measurement. Only one of the two survives a sceptical buyer.
Why Salescode AI Native DMS can actually attribute the number
Salescode AI Native DMS can attribute uplift because measurement is built into the architecture, not added at the end.
The platform runs a six-layer AI Native orchestration architecture with the Intelligence Core at Layer 03, where the prediction models sit above the operations layer and read every transaction as it happens. That core carries seven AI/ML capabilities driving sales and distribution uplift:
- • secondary order prediction
- • stock-out prediction and alerts
- • primary order recommendation
- • remote order
- • load-out recommendation
- • pre-order for van routes
- • outlet attrition prediction
Because those models run in the core rather than a separate analytics tool, their effects surface on the Sales Impact Dashboard lever by lever, which is what makes uplift attributable rather than asserted. Actual results still depend on baseline, channel mix, and rollout scope, and a serious vendor says so out loud.
One simple tell that the models are in the loop, not just switched on for the demo:
- • In one live distributor account, 299 of 320 primary orders were generated by the Auto-Replenishment System, not keyed in by hand.
- • The platform handles more than 1.2 million orders a month across seven transaction types (primary, secondary, invoices, load-out, stock, claims, settlements).
A model genuinely driving orders can be measured on the orders it drove.

Why Salescode Al Native DMS can attribute the number
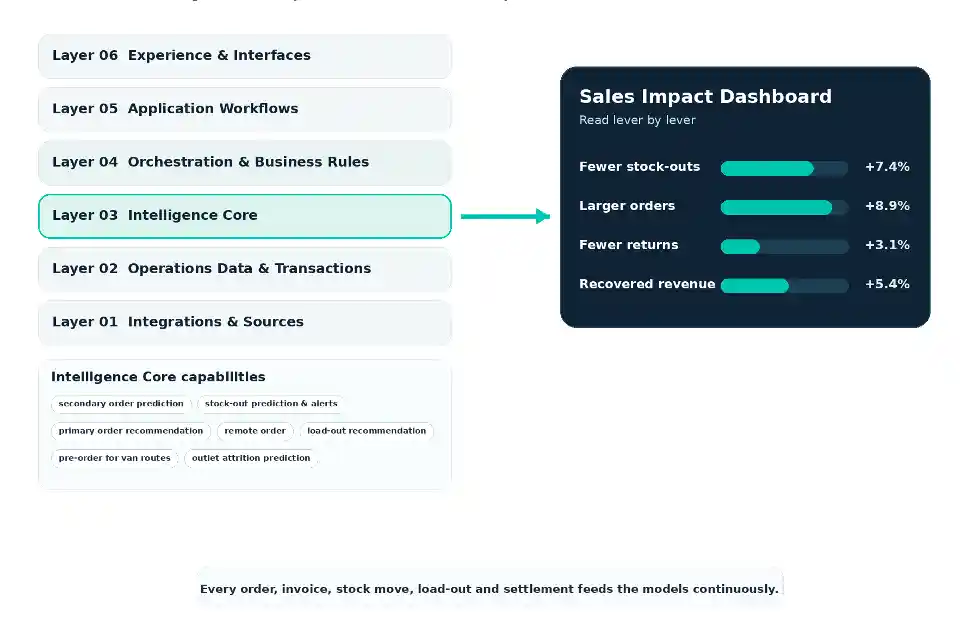
Prediction sits in the Intelligence Core at Layer 03, so its effect is read per lever, not inferred after the fact.


